
When a snap-request errors out, the logs are where the answer is. They also help with the quieter failures: a screenshot that looks off, an image that 404'd, a font that took too long to load, something asynchronous that finished after the screenshot was taken. Happo has kept logs for every snap-request for a while, but reading them meant opening one snap-request's log at a time. A report with ten targets meant at least ten tabs, and large targets are split across several snap-requests, so a big report means quite a few more than that. Plus a lot of scrolling in each one to find the component you cared about.
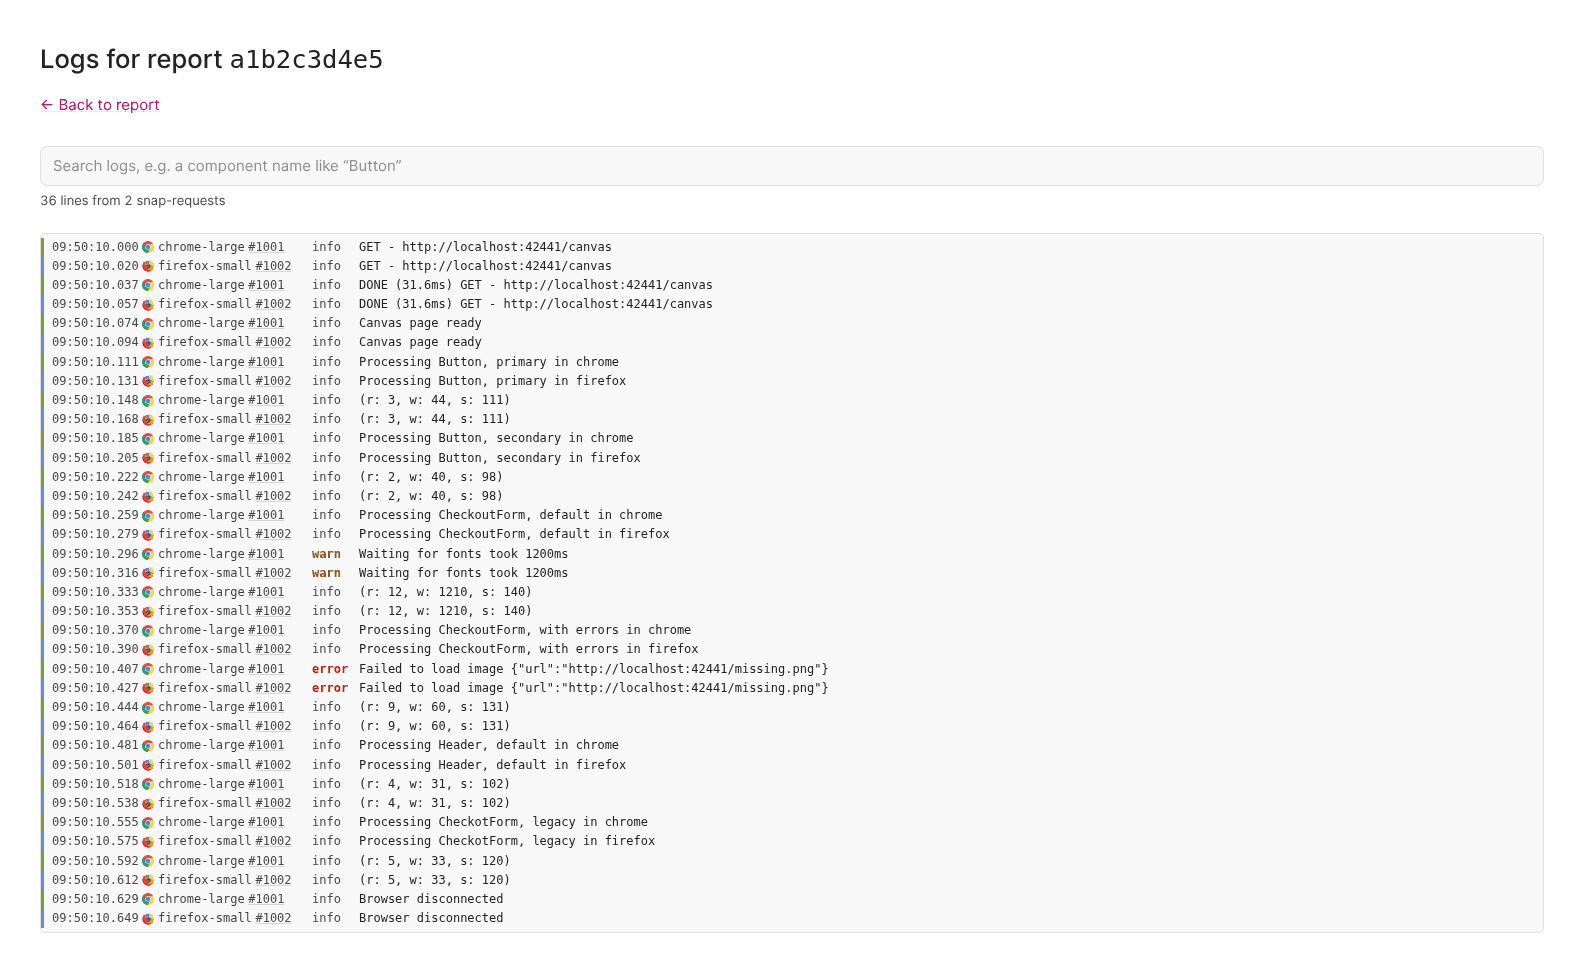
Every report now has a single logs page that brings all of that together.
One timeline for the whole report
The logs page loads the log of every snap-request behind a report and merges the lines by timestamp. Each line shows which target it came from and links to its snap-request, so you can tell at a glance whether a warning happened in Chrome, Firefox, or any other target.
Warnings and errors are highlighted, which makes the interesting lines stand out from the steady stream of "Processing…" messages. In the example above, both browsers waited 1.2 seconds for fonts on the same component, and both failed to load the same image. That's the kind of pattern that's hard to spot when you're reading one log at a time.
Search that finds the component you're after
Most of the time you're not reading the whole log, you're looking for one component. Type its name into the search box and the page switches to showing just the matching lines, each with a few lines of context from the same snap-request.
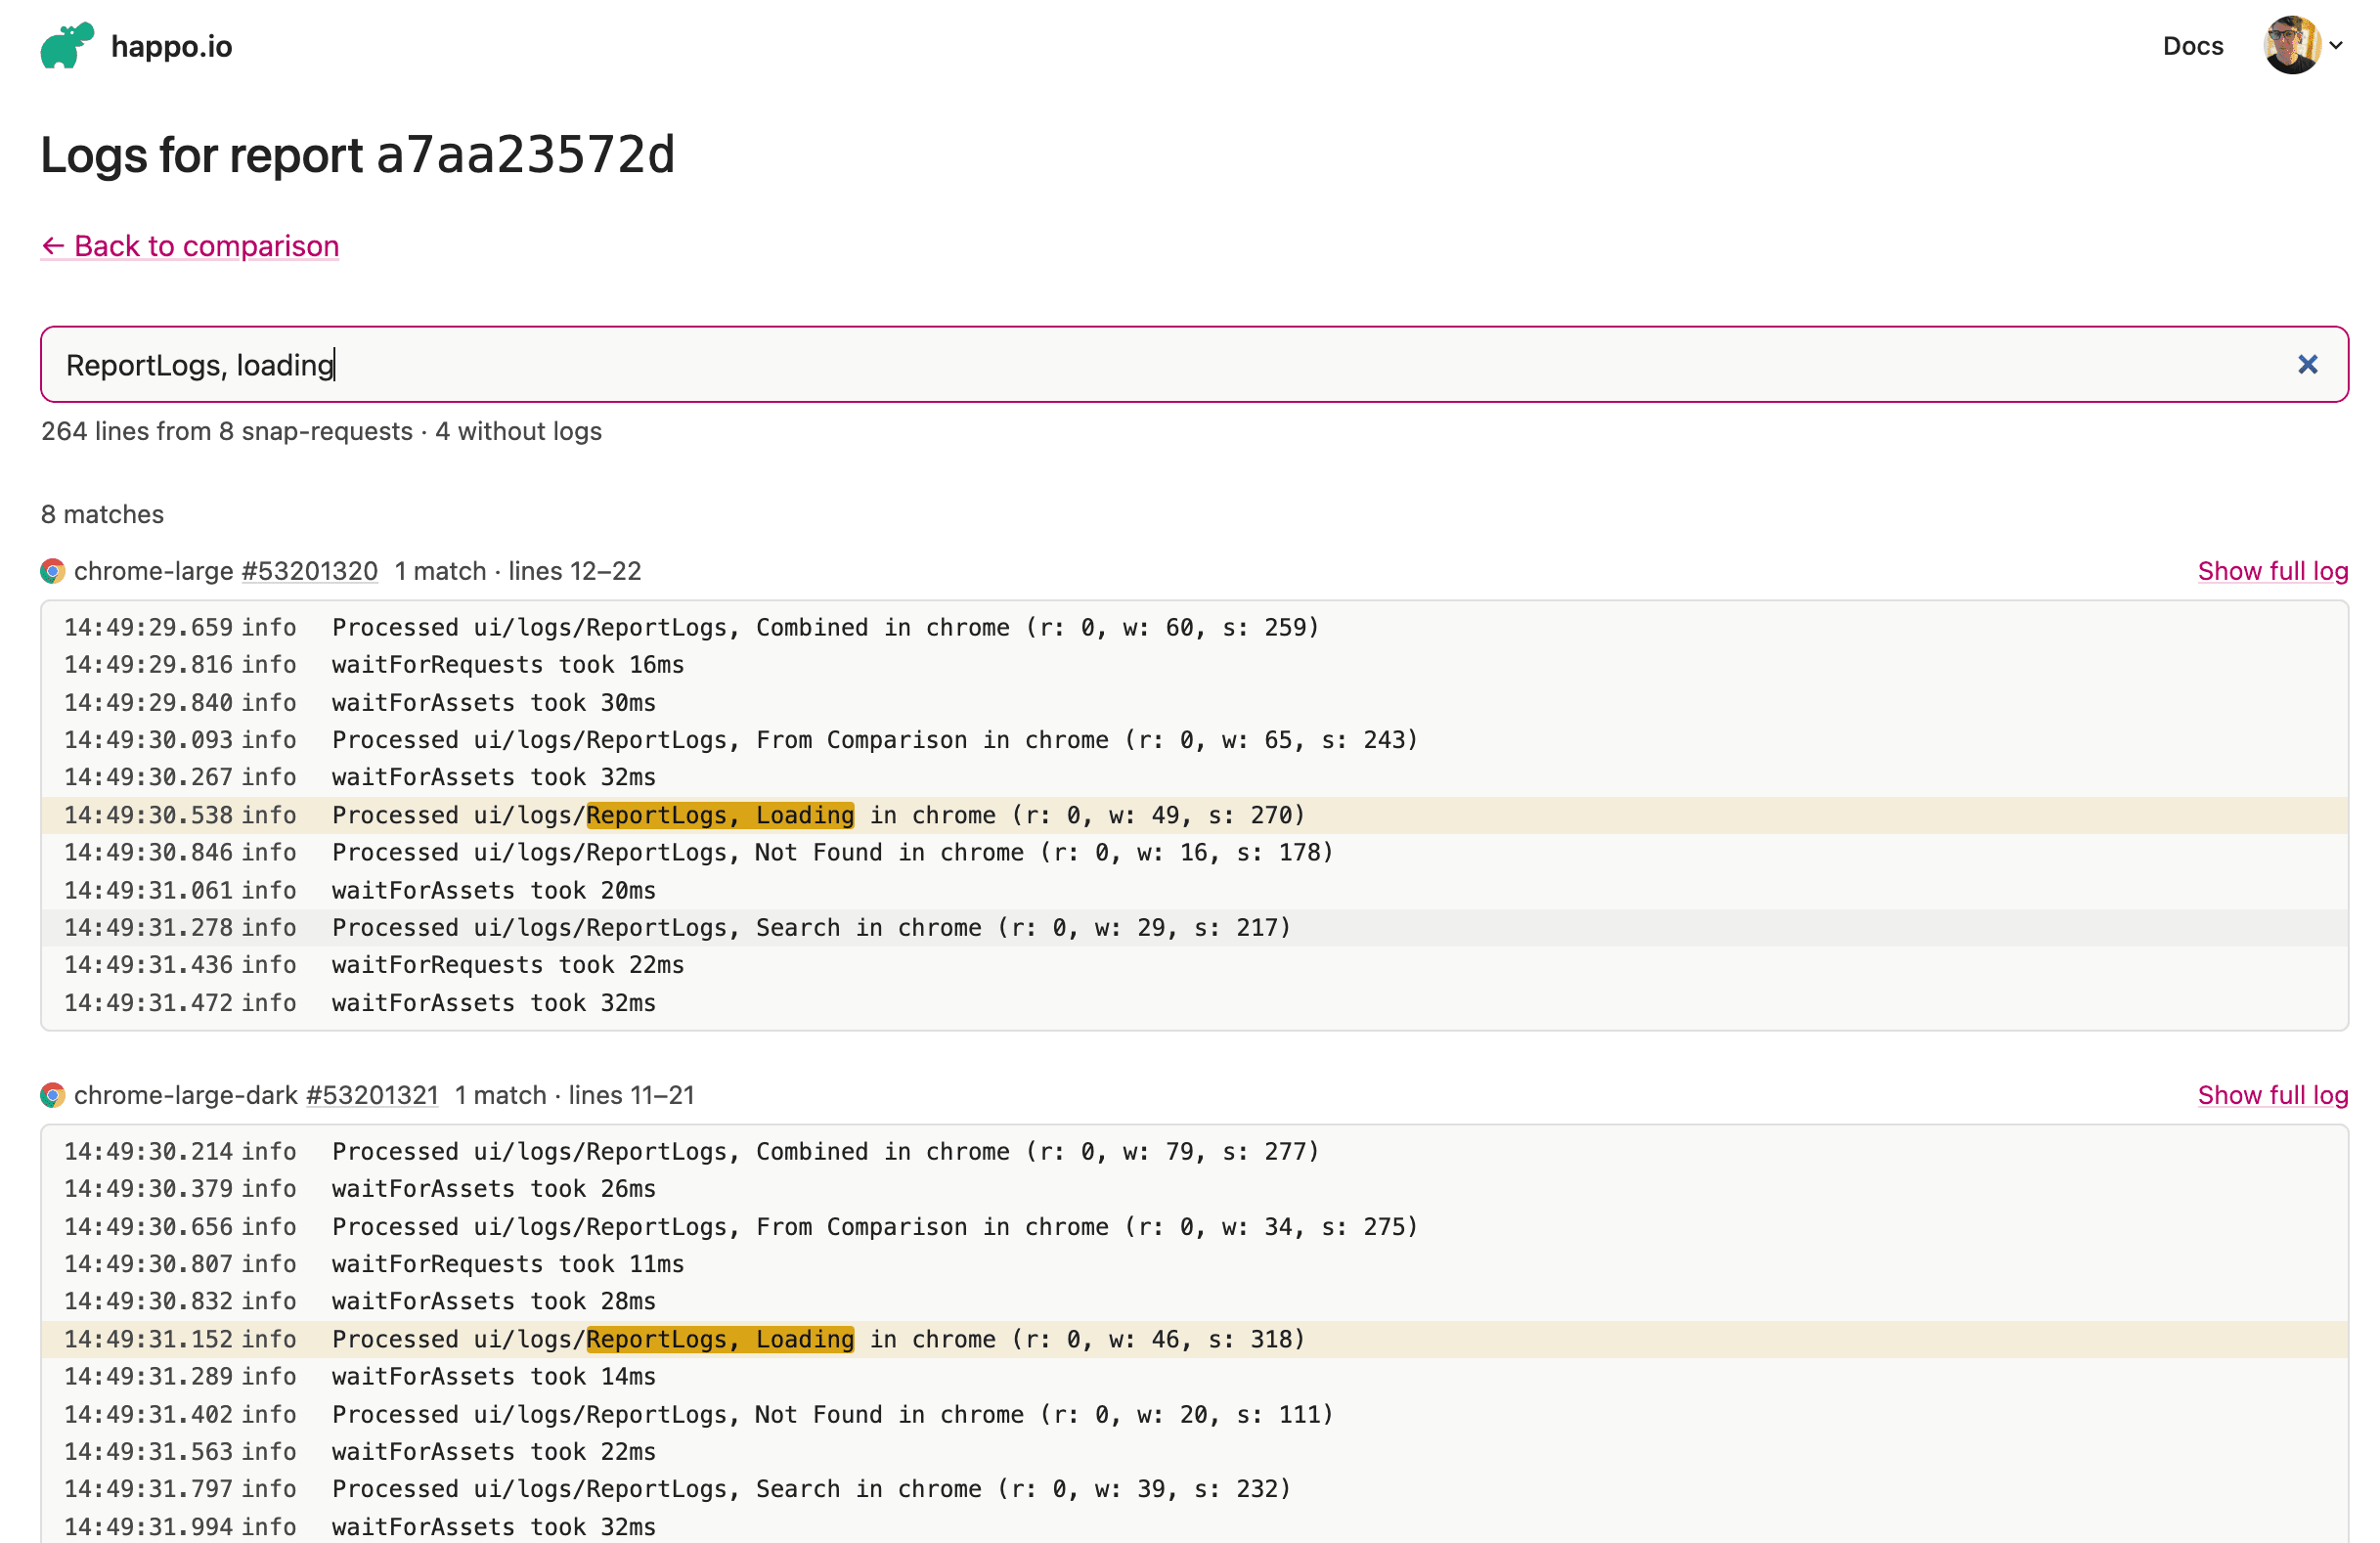
Search ignores case and tolerates typos. Short queries have to match exactly, and longer ones allow a few characters to be off. When there are exact matches, typo-only matches are tucked behind a "Show similar matches" toggle so they don't crowd out what you asked for.
Every line gets a plain case-insensitive substring check first, and that is the end of it for most searches. Only when that misses do we look for an approximate match, allowing one edit (an inserted, deleted or substituted character) per five characters of the query, up to three.
When a match needs more context, click "Show full log" (or the matching line itself). That snap-request's full log expands in place, scrolled to the line you clicked.
Where to find it
Look for a "View logs" link in these places:
- The sidebar on a comparison page
- The report page
- The async report page
The whole page runs in the browser. Logs are fetched a few snap-requests at a time and added to the page as they arrive, so you can start searching before everything has loaded.
If there's something you wish the logs told you, or something you're still hunting for across tabs, let us know at support@happo.io.

