
For years, our answer to peak load was embarrassingly simple: make the node pool bigger.
Traffic spikes? Add nodes. Worried about a busy afternoon? Add more nodes. It worked, but in the way that buying a bigger parking lot works: most of the spaces sat empty most of the time, and we paid for all of them anyway.
That approach holds up for a while. It stops holding up when you're growing, and it really stops holding up when you're about to onboard a customer with a very large screenshot workload. So we finally did the thing we'd been putting off: real auto-scaling for our screenshot workers.
The result was dramatic. During bursts, average queue wait time dropped from 138 seconds to under 20 seconds. The strategy that made the biggest difference was scaling on queue depth, pre-warming capacity before work arrived, and dampening that pre-warm signal so large estimates didn't blow up the fleet.
This post is mostly about Kubernetes details, but the pattern is reusable anywhere work arrives in bursts.
Why the workload is so bursty
Each worker is a pod in our Kubernetes cluster that runs a browser to take screenshots and generate accessibility reports. The unit of work it pulls off the queue is a snap request. A snap request doesn't map one-to-one to a report: we split a large suite into many snap requests so they can render in parallel, and for Playwright and Cypress we create one snap request per test and combine the results into a single report. What matters for scaling is just how many snap requests are waiting. This work is triggered by CI jobs in our customers' repositories, so our load tends to follow developers' working hours.
Because Happo customers are spread across time zones, those spikes are distributed throughout the day rather than concentrated into one global peak. Even so, the workload is still bursty. Engineers often push work before lunch or at the end of the day, and sometimes automation makes the spikes much worse.
A repository with a large Happo suite, combined with Dependabot or Renovate opening a batch of PRs at once, can drop a wall of work on us in seconds. Workers also need time to warm up, especially if the node pool itself has to scale. A new worker pod can start on a warm node in a few seconds, but bringing a new node online can take about three minutes.
That delay matters because queue buildup affects everyone. When a burst hits, we need to add capacity quickly enough that developers don't end up staring at a pending status check.
Here's one example from our logs. During a thundering-herd event, 95 snap requests arrived within a single minute. They waited an average of 2 minutes 18 seconds, with a maximum wait of 3 minutes 7 seconds. That's long enough to pull someone out of their flow state while waiting for a PR check to clear.
The boring wins: smaller image, faster probes
Before changing our scaling strategy, we fixed the obvious sources of startup latency.
The first was our worker Docker image, which was 1.75 GiB compressed. The biggest single win here came from a two-line change: switching Chrome to --only-shell, which installs only the headless portion of the browser. Our workers run in Kubernetes without displays, so the full headed build was just dead weight.
We also used dive to inspect each image layer and trim files we didn't need. That brought the compressed image down to 1.1 GiB, about a 37% reduction. We also tried SlimToolkit, but it didn't help in our case.
The second fix was more embarrassing in hindsight. Our pods were often ready, but Kubernetes wasn't marking them ready yet because the startup probe was too slow. We had a 5-second initial delay and only checked every 10 seconds.
Instead of this:
startupProbe:
  httpGet:
    path: /
    port: 4444
  initialDelaySeconds: 5
  periodSeconds: 10
  timeoutSeconds: 5
  failureThreshold: 30
We now use this:
startupProbe:
  httpGet:
    path: /
    port: 4444
  initialDelaySeconds: 0
  periodSeconds: 2
  timeoutSeconds: 5
  failureThreshold: 150
That change cut pod ready time from about 15 seconds to about 2 seconds.
These changes didn't fix the scaling problem on their own, but they did make new capacity come online much faster. When you're scaling against queued work, that speed matters: if pods take too long to become useful, even a smart autoscaler will still react too slowly.
The real fix: KEDA and scaling on queue depth
Kubernetes ships with CPU-based horizontal pod autoscaling, and that's what we'd been relying on.
For our workload, CPU was the wrong signal.
Some screenshots take a long time to render while barely using CPU, because the worker is waiting on assets like fonts and images to load. From the user's perspective, work is backed up. From CPU's perspective, everything looks mostly fine. That mismatch meant CPU utilization told us very little about how much demand was actually waiting or how many workers were actually working.
We switched to KEDA so we could scale on queue size instead. Queue depth tells us exactly how many jobs are waiting, regardless of whether those jobs are CPU-bound or mostly blocked on I/O. That shift was the foundation for everything else.
The anticipated signal: pre-warming before the work arrives
Queue depth is much better than CPU, but it's still reactive. By the time work is visible in the queue, the developer is already waiting.
So we added an earlier signal.
When a Happo run starts in your CI, it first tells us that the job has started. We use that to create a landing page for the run and update the PR status check so the work is visible right away. But the CI job still has more work to do before it starts sending actual screenshot requests: it may need to build Storybook, upload assets, or do other setup.
That gap between job started and snaps arrive is our opportunity. We use it to start scaling before the burst lands.
We write an anticipated snap request count into Redis, and KEDA folds that into its scaling decision. This also helps us avoid scaling down too aggressively when we know more work is likely to arrive shortly.
The gap between anticipated work and actual queued work varies by customer. It depends on the size of their Happo suite, how their CI pipeline is structured, and even which tools they use. A Storybook build with webpack behaves differently from one built with Vite. In practice, the gap is usually under a minute, though it can be longer for larger runs.
A naive approach would scale up one worker per anticipated snap request. That would over-provision badly. Once workers are ready, the queue often drains nearly as fast as it fills, so a large anticipated count shouldn't translate into a proportional surge in replicas.
That's where dampening comes in:
formula: >-
  active + ((wait + prioritized) ** 0.909) +
  (max(0.0, anticipated - (active + wait + prioritized)) ** 0.625)
target: '1'
In plain English, we weight the signals differently:
- active jobs count 1:1. Each one already has a worker, and under-provisioning there would strand in-flight work.
- wait + prioritized jobs count almost 1:1, but sub-linearly. We're willing to let jobs wait briefly rather than chase every short burst with immediate new capacity.
- anticipated work gets even heavier dampening. We want a pre-warm bump, not runaway scaling based on an estimate.
The exact exponents came from experimentation, but the intuition is straightforward: a larger fleet can absorb more fluctuation than a smaller one, so the bigger the counts get, the less each additional unit should move the system. We'd rather be a little over-provisioned than let customers sit in a queue, but we still want that buffer to grow in a controlled way.
What it bought us
To tune the KEDA autoscaler, we charted wait time, queue size, active worker count, and anticipated count together in Datadog. We'd try a change, watch the graphs for a while, and then adjust.
During bursts, average wait times dropped from 138 seconds to under 20 seconds.
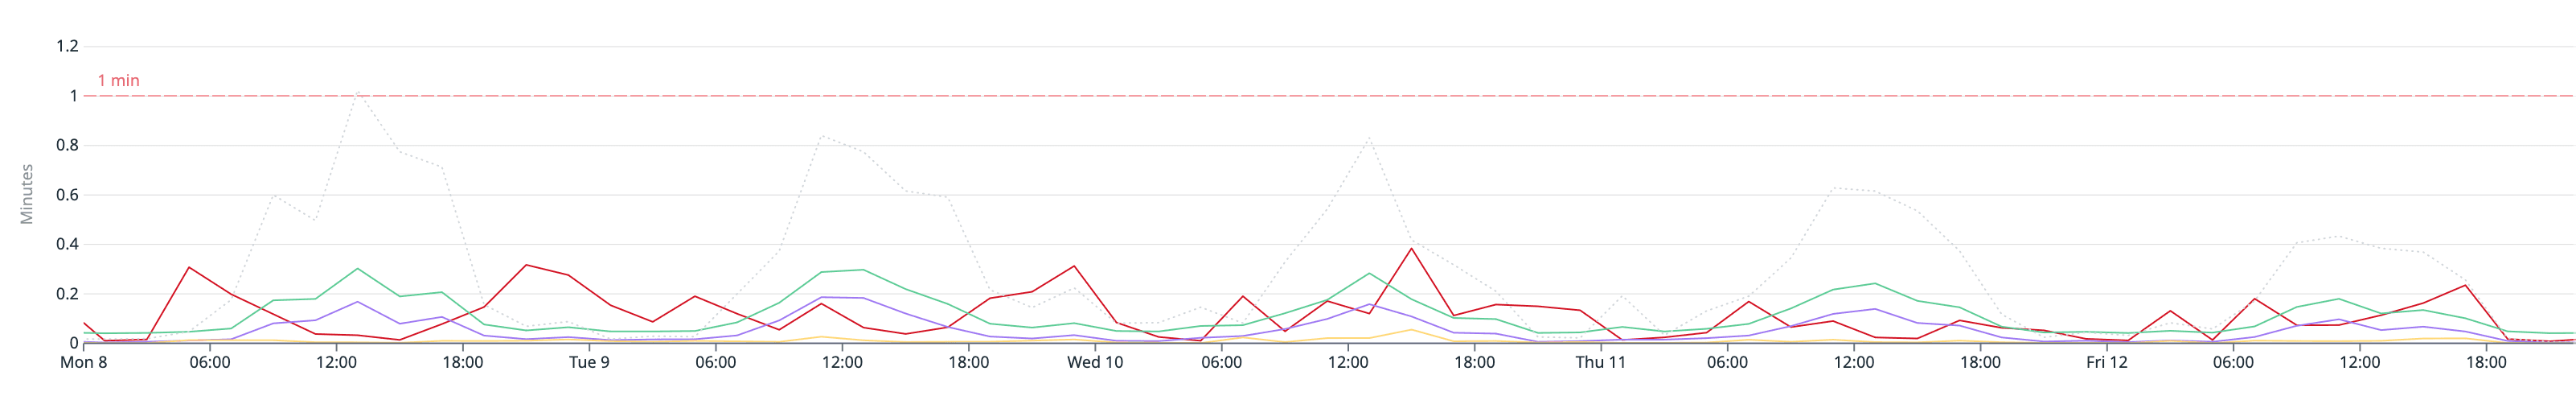
Legend:
- red: wait time
- green: total workers
- purple: active workers
- yellow: queue backlog
- dashed gray: anticipated queue
The strategy also reduced cost substantially. Last month, we paid 61% less than we would have if we had stayed pinned at max scale. Just as importantly, we now have room to absorb much larger bursts without manually rethinking capacity every time demand grows.
The reusable pattern
For bursty workloads, the main lesson wasn't "tune your probes" or "make your image smaller," even though both helped.
Instead, this was the formula:
- scale on backlog, not on CPU, when CPU doesn't reflect user-facing delay
- look for an earlier predictive signal if one exists
- dampen that predictive signal so estimates don't cause runaway over-scaling
- make startup fast enough that scaling decisions can take effect before users feel the delay
That combination is what turned a 138-second queue wait into a non-event for us.